

Now a days businesses rely on data science to guide their market strategies, identify trends, understand customer behavior and stay ahead of the competition. Market analysis through data science techniques empowers companies to make informed decisions, optimize their marketing efforts and increase their return on investment (ROI).
This article will explore some of the essential data science techniques for market analysis, such as trend analysis, customer segmentation and competitor analysis using data analytics. We shall explain how these techniques help in strategic planning, the importance of data cleaning and the role of data visualization for presenting the facts and figures to stakeholders. Real world examples and case studies will demonstrate the impact of these techniques in action.
What Is Market Analysis?
Market analysis is the process of examining a particular market to understand its dynamics, trends, customer preferences and competitors share. Data science plays very important role in market analysis which enables organizations to analyze large datasets, derive actionable tips and make decisions based on data. This approach helps businesses to predict future trends, identify market opportunities and respond proactively to customer needs.
Why Data Science is Important for Market Analysis
Data science uses advanced statistical, computational and machine learning methods to extract valuable tips from complex datasets. In market analysis, data science helps businesses to:
– Identify emerging trends.
– Segment customers based on behavior and preferences.
– Analyze competitors’ strategies.
– Make data driven strategic decisions to enhance performance.
Key Data Science Techniques for Market Analysis
Following are the main techniques used for market analysis using data science.
1. Trend Analysis
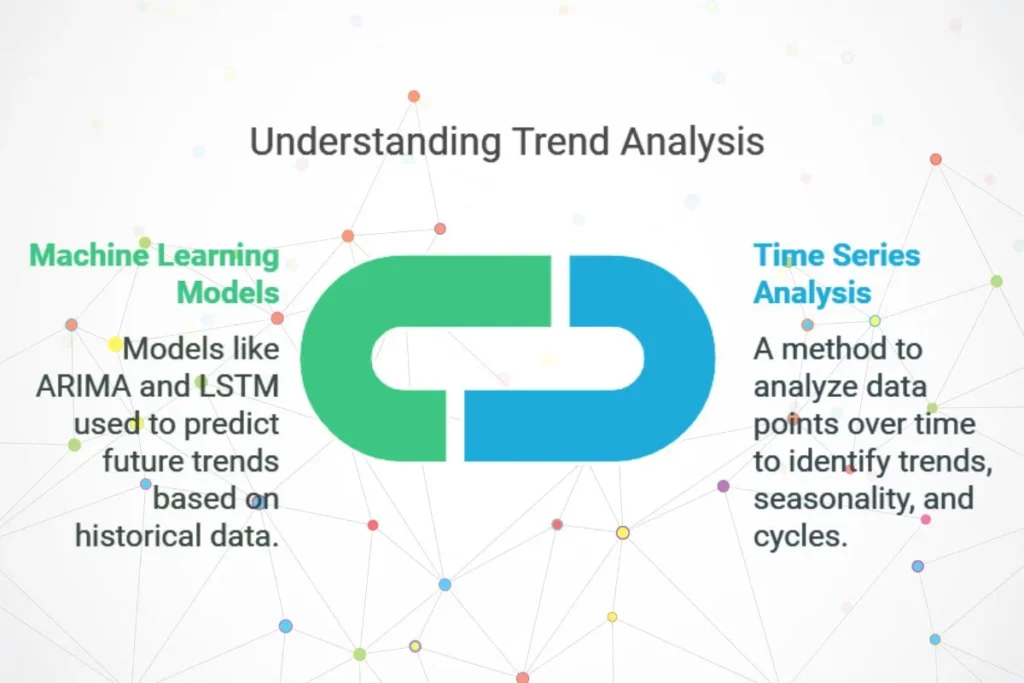
Trend analysis is used to identify patterns in data over a specific time period. By examining historical data, businesses can predict future market behavior and prepare accordingly.
Techniques Used:
– Time Series Analysis: A statistical technique that analyzes time ordered data points. Time series analysis is essential for identifying trends, seasonality and cycles in sales, customer behavior and other market factors.
– Machine Learning Models: Models like ARIMA (Auto-Regressive Integrated Moving Average) and LSTM (Long Short-Term Memory) neural networks are often used to predict future trends based on past data.
Real World Example:
A retail company might use time series analysis to forecast seasonal demand for products, which enables them to manage inventory efficiently. For instance, by analyzing historical data, a clothing retailer can predict the peak demand for winter jackets, which ensures they are stocked adequately to meet customer demand.
2. Customer Segmentation
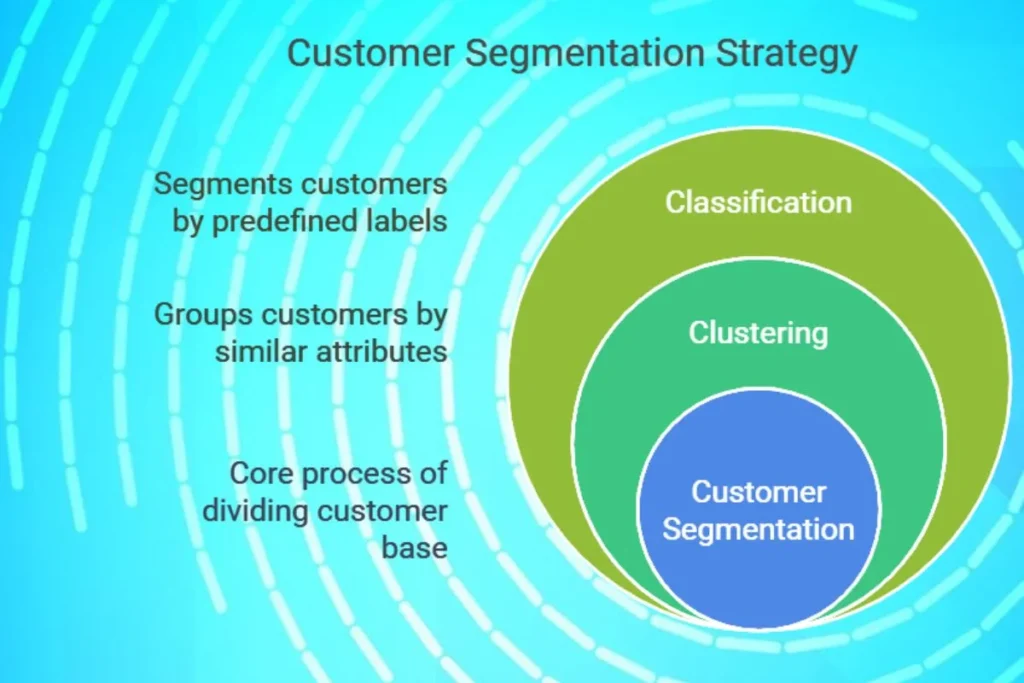
Customer segmentation is the process of dividing a customer base into distinct groups based on characteristics such as demographics, purchasing behavior or preferences. This allows businesses to target specific groups more effectively and adjust their marketing efforts to suit the customers.
Techniques Used:
– Clustering: Techniques like K-means clustering and hierarchical clustering are widely used for grouping customers with similar attributes.
– Classification: Classification algorithms such as Decision Trees and Random Forests help in segmenting customers based on predefined labels (e.g., high-value customers, frequent buyers).
Real-World Example:
Netflix uses customer segmentation to personalize its recommendations. By analyzing viewing habits, demographics and customer feedback, Netflix segments its users and offers tailored content, which results in higher engagement and customer satisfaction.
3. Competitor Analysis
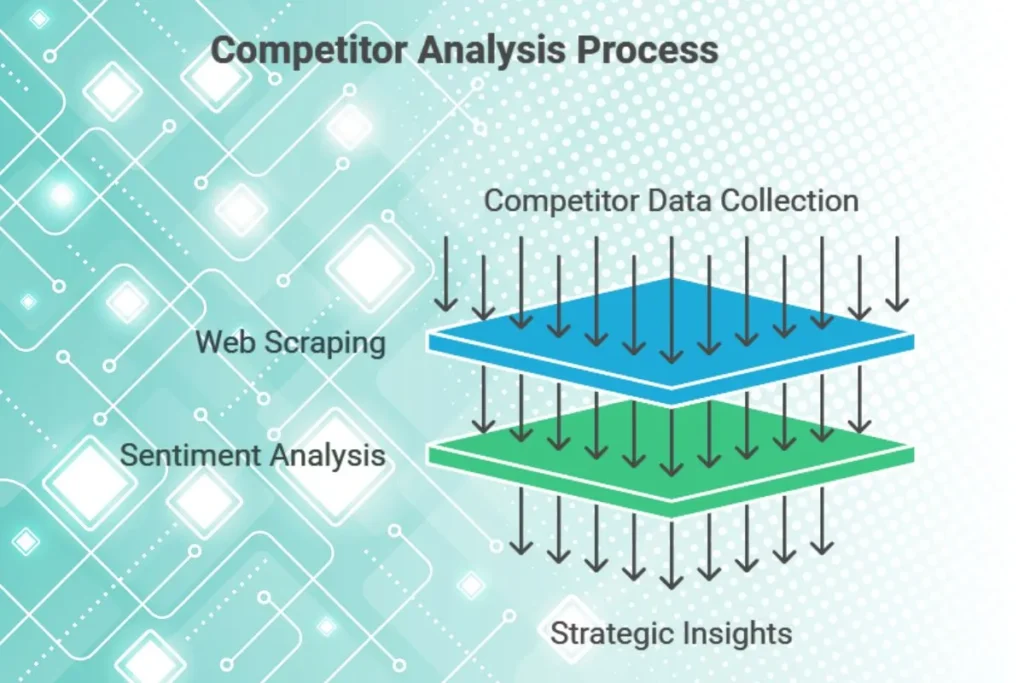
Competitor analysis is a important part of market analysis that involves assessing competitors’ strengths, weaknesses, strategies and market position. This helps businesses benchmark their performance, identify gaps and find opportunities for differentiation.
Techniques Used:
– Web Scraping: Data scientists use web scraping to gather data from competitors’ websites, social media and online reviews. This data can include pricing, customer sentiment and product offerings.
– Sentiment Analysis: By analyzing social media and review data, companies can gauge public sentiment about competitors and their products.
Real-World Example:
A company like Coca-Cola may use sentiment analysis to monitor customer opinions on social media about both Coca-Cola and its competitors Pepsi. This helps Coca-Cola to understand its brand perception relative to competitors and make strategy for marketing efforts accordingly.
4. Predictive Analytics
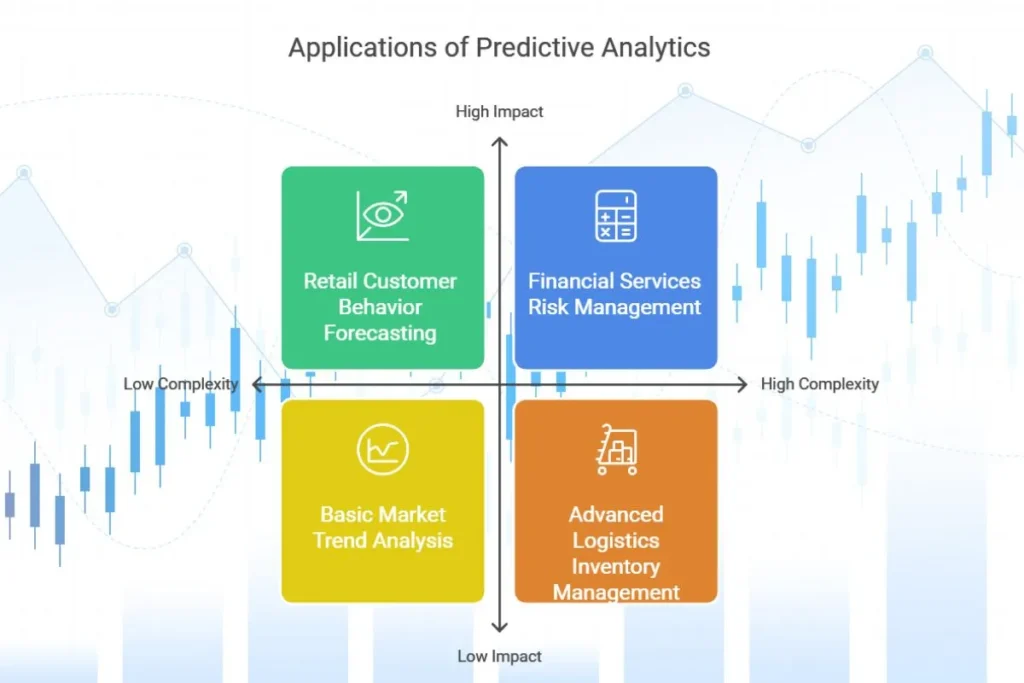
Predictive analytics uses historical data and machine learning algorithms to predict future outcomes. In market analysis, predictive analytics can forecast customer behavior, product demand and market trends.
– How It Works: Predictive analytics relies on regression models, decision trees and neural networks to find relationships between variables and make predictions about future events.
– Applications: Predictive analytics is widely used in financial services, retail and logistics to anticipate customer needs, manage inventory and reduce operational risks.
Example: Walmart uses predictive analytics to forecast demand for products during different seasons. This allows them to stock up on items that are likely to be in high demand, which helps to optimize inventory and reduce costs.
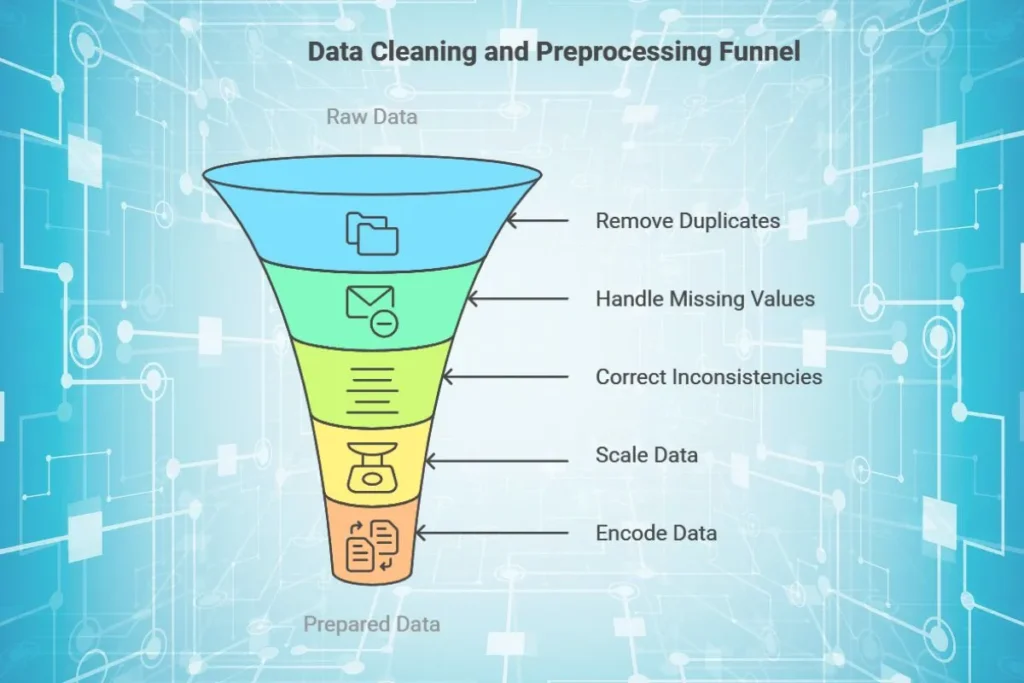
5. Data Cleaning and Preprocessing
Data cleaning and preprocessing are foundational steps in data science. Clean data is essential for accurate analysis and information. In market analysis, data often comes from various sources and formats, so it must be organized and standardized before analysis.
– How It Works: Data cleaning involves removing duplicates, handling missing values and correcting inconsistencies. Preprocessing may include scaling, encoding and transforming data to prepare it for machine learning models.
– Applications: Every industry that relies on data uses data cleaning and preprocessing to ensure the reliability and accuracy of their analyses.
Example: Before analyzing customer data for a loyalty program, a retailer must clean the dataset to remove outdated or incomplete records. This step ensures that insights derived from the data are accurate.
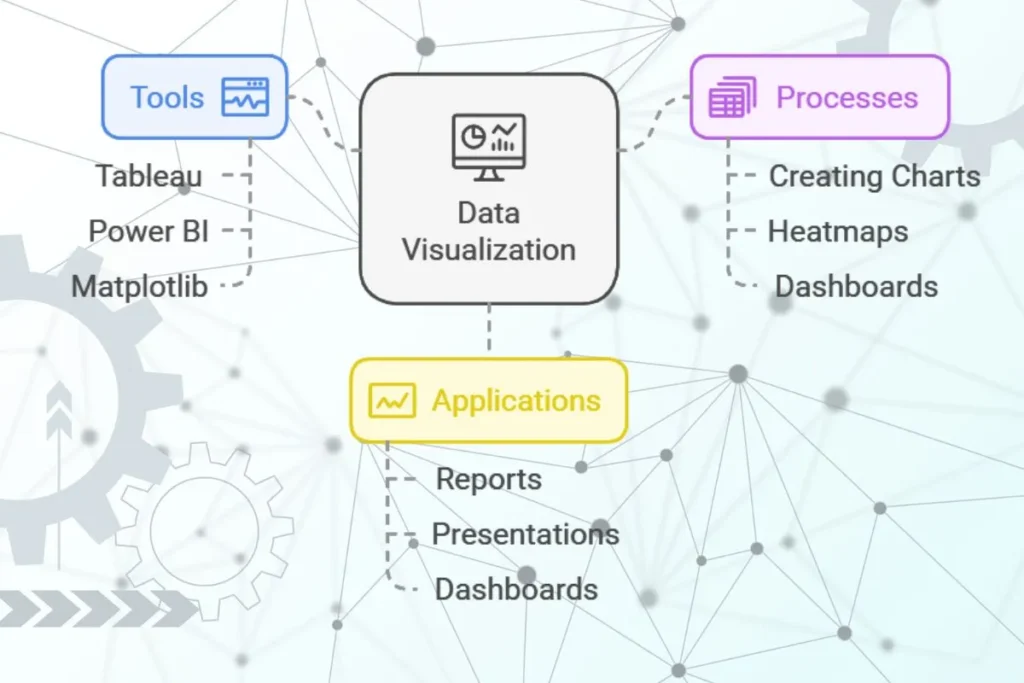
6. Data Visualization
Data visualization is the process of creating visual representations of data, such as charts and graphs, to make complex data easy to understand. For market analysis, visualizations help stakeholders quickly grasp insights and trends.
– How It Works: Visualization tools like Tableau, Power BI, and Python’s Matplotlib allow data scientists to create various charts, heatmaps and dashboards that highlight key findings.
– Applications: Data visualization is used in reports, presentations and dashboards to communicate insights effectively to non-technical stakeholders.
Example: A financial analyst might use a bar chart to compare revenue growth between two quarters, which makes it easy for executives to understand performance at a glance.
Real World Case Study:
Walmart’s Use of Data Science in Market Analysis
Walmart, one of the largest retailers in the world, uses data science to drive market analysis. By leveraging customer data and advanced analytics, Walmart can predict demand, optimize inventory and personalize marketing.
Key Techniques Used:
1. Trend Analysis: Walmart uses time series analysis to forecast demand for various products, which help them to manage inventory efficiently and reduce waste.
2. Customer Segmentation: Walmart segments its customers based on purchasing behavior, which allows it to offer personalized discounts and targeted promotions.
3. Competitor Analysis: Walmart continuously monitors competitors’ pricing strategies and customer sentiment on social media to stay competitive.
This data driven approach has helped Walmart streamline operations, reduce costs and improve customer satisfaction, demonstrating the immense value of data science in market analysis.
How Data Science Techniques Enhance Strategic Planning
By using these data science techniques, businesses can make strategic decisions that are aligned with market demands and customer needs. Here’s how each technique contributes to strategic planning:
– Trend Analysis: Identifies long term shifts in customer behavior, which helps businesses to adapt their offerings to meet future demands.
– Customer Segmentation: Enables targeted marketing, which improves the effectiveness of promotional campaigns and enhances customer experience.
– Competitor Analysis: Provides tips for market positioning, which helps businesses to adjust pricing, product features, or branding to differentiate themselves.
Conclusion:
Data science has transformed the way how businesses approach market analysis. By applying techniques like trend analysis, customer segmentation and competitor analysis, companies can gain a deeper understanding of the market, make informed decisions and drive growth.
Incorporating data cleaning and visualization into the process, they ensure that the information is accurate, actionable and accessible to all stakeholders. This data driven approach to market analysis offers a competitive edge, which allows businesses to stay responsive and grow progressively.