Now a days marketing professionals need to analyze data deeply and accurately, as the amount of data is large. The right data analytics tools helps marketing professionals to gain deeper information into customer behavior, measure campaign effectiveness, track website traffic and ultimately, make data driven decisions that drive growth.
Here, we study some of the top data analytics tools for marketing professionals – Tableau, Google Analytics, Power BI and SAS Analytics. We’ll explore how each tool can help you uncover customer information and deliver impressive marketing strategies, along with tips on data visualization for effective stakeholder communication.
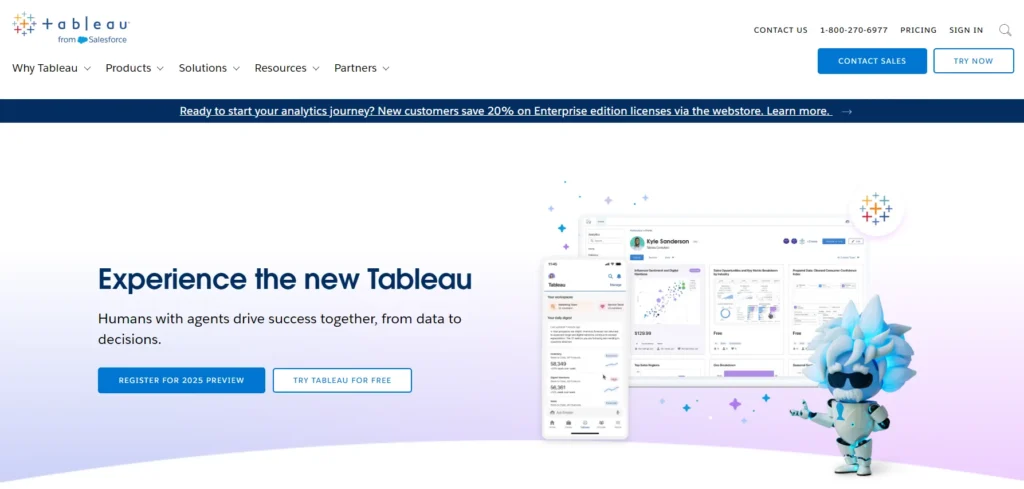
1. Tableau: Simplifies Complex Data for impressive Visualizations
Overview
Tableau is renowned for its powerful data visualization capabilities, making it a favorite among marketers who need to convert complex data into understandable, visually engaging information. It’s widely used across industries for its ease of use, drag and drop interface and ability to connect with various data sources.
Key Features:
– Data Visualization: Tableau excels at transforming data into interactive visualizations, from basic bar charts to complex heatmaps and geographical plots.
– Data Integration: Connects seamlessly with databases, spreadsheets and cloud data platforms, consolidating all data into one view.
– Real-Time Analytics: Offers real time data analytics for monitoring ongoing campaigns and adjusting strategies on the go.
How It Helps Marketers:
Tableau enables marketers to create custom dashboards to track KPIs, such as customer engagement rates, conversion rates and sales performance. By visualizing data trends over time, marketers can pinpoint which campaigns are driving the most impact, adjust ad spend and present insights in a compelling way to stakeholders.
Example:
Consider a retail company launching a new product. Tableau’s visualization tools can highlight which channels drive the highest engagement and revenue. This provides quick answers to re-allocate budgets in real time.
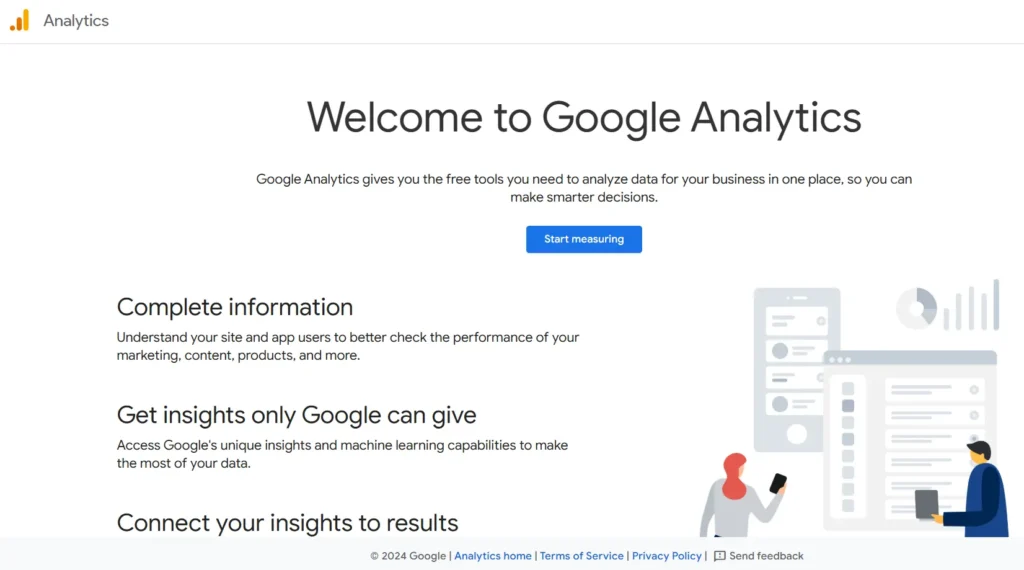
2. Google Analytics: Tracking Website and Campaign Performance
Overview
Google Analytics is one of the most widely used analytics platforms for tracking website traffic and user behavior, which allows marketers to understand how visitors interact with their site. It provides a wide array of data, including website traffic, user behavior, conversion rates and much more.
Key Features:
– Real-time tracking: Monitor active users on your site in real time.
– User demographics: Understand your audience based on location, age, gender and interests.
– Traffic sources: Determine where your visitors are coming from (e.g., organic search, social media or email).
– Traffic and Audience Insights: Provides detailed metrics on website visitors, such as location, device type, demographics and user behavior.
– Campaign Tracking: Allows for tracking campaign performance using UTM parameters to measure traffic sources.
– Goal and Conversion Tracking: Enables setting specific goals, such as form submissions or sales, to measure conversions and assess campaign effectiveness.
How It Helps Marketers
Google Analytics enables marketers to track key metrics, like bounce rate, session duration and user journey paths. It helps to answer questions like, “Where are customers dropping off?” and “Which traffic sources bring the highest conversions?” Marketers can then refine their SEO, content and social media strategies based on real data.
Example
An e-commerce business launching a new ad campaign can use Google Analytics to track which landing pages attract the most users and how many visitors convert. This data can guide future marketing decisions. This ensures the budget is allocated to high-performing channels only.
3. Power BI: Turning Raw Data into Actionable Information
Overview
Microsoft Power BI is a strong analytics tool that combines data analytics and visualization, which makes it a powerful choice for businesses who seek a scalable solution. Power BI integrates with Microsoft products and various third party tools, which provides a comprehensive view of marketing performance.
Key Features:
– Data Connectivity: Connects to hundreds of data sources, including Excel, SQL databases and third party applications.
– Customizable Dashboards: Allows users to create suitable dashboards that showcase the most important metrics.
– Data visualization: Create interactive reports and dashboards.
– Predictive Analytics: Uses AI driven tools to forecast trends and analyze data patterns.
How It Helps Marketers:
With Power BI, marketers can monitor key metrics and trends in one dashboard, which makes it easier to share information with cross functional teams. It is especially helpful for marketers who work with data heavy metrics, such as customer lifetime value, churn rates and campaign ROI.
Example:
A SaaS company using Power BI can track customer acquisition costs (CAC) across different channels. If social media ads yield a lower CAC than email marketing, they can allocate more budget to social media for greater cost effectiveness.
4. SAS Analytics: Advanced Analytics for Deep Market Understanding
Overview
SAS Analytics offers advanced data analytics capabilities, often used for deeper market information and predictive analytics. With strong data mining and statistical analysis features, it’s well suited for large organizations with complex data analysis needs.
Key Features:
– Predictive Analytics and Machine Learning: SAS excels in predictive analytics, which uses machine learning to identify trends and forecast future outcomes.
– Text Analytics: Analyzes unstructured data, such as social media posts or customer reviews, to uncover brand sentiment.
– Segmentation and Targeting: Uses data clustering to create detailed customer segments for precise targeting.
– Campaign management: Measure campaign impact and optimize for better performance.
How It Helps Marketers:
SAS allows marketers to dive deep into customer data, which identifies segments based on behaviors, demographics or psychographics. Its machine learning capabilities also help marketers to forecast trends, which enables them to proactive campaign planning.
Example:
An insurance company might use SAS to analyze customer feedback from multiple sources to check sentiment around a recent policy change. The information derived from this analysis can guide to make customer service improvements and marketing strategies.
5. HubSpot Analytics
Overview:
HubSpot is a comprehensive CRM and marketing platform that offers built in analytics to help marketers track website traffic, lead generation and conversion metrics.
Key Features:
– Lead tracking: Monitor leads from initial contact to conversion.
– Content performance: Measure how well blogs, emails and social posts perform.
– Customer journey insights: Map the customer journey to improve conversions.
– A/B testing: Run experiments to optimize campaign performance.
Benefits for Marketers:
HubSpot Analytics provides valuable information into how marketing efforts influence lead generation and customer acquisition, which makes it particularly useful for inbound marketers. It’s a great choice for small to medium sized businesses who are focused on increasing leads and driving engagement.
Example Use Case:
A software company uses HubSpot to track lead generation from blog posts and email campaigns. By analyzing which content brings in the most qualified leads, they adjust their content strategy to attract similar audiences.
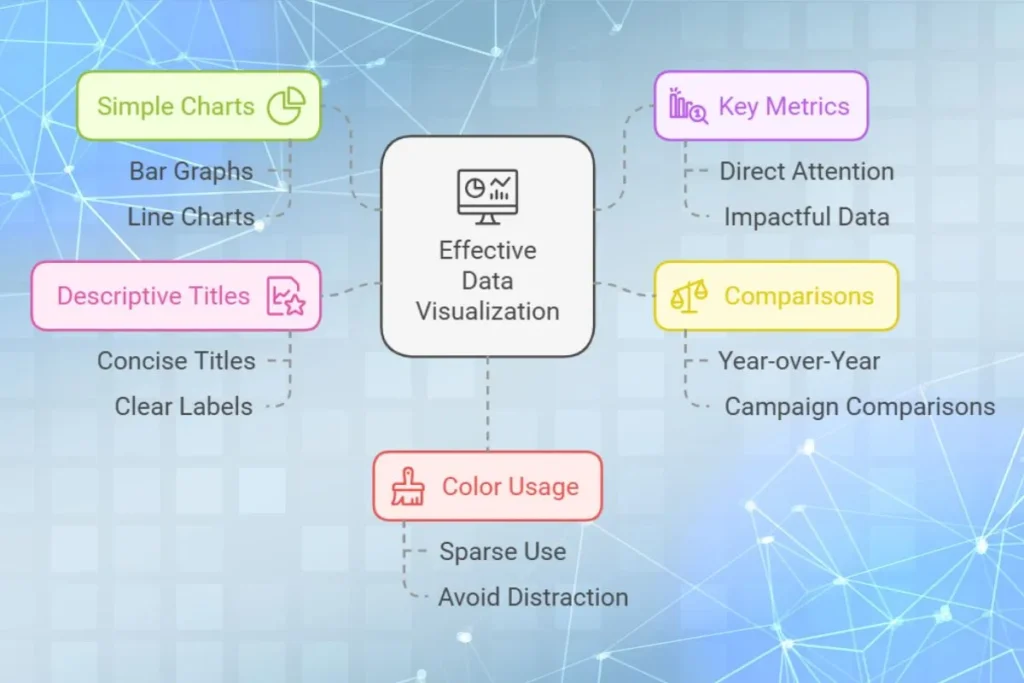
How to Visualize Data Effectively for Stakeholders
Good data visualization makes the information easy to understand and action upon. Here are a few tips to help you to create clear and compelling data visualizations:
1. Use Simple Charts:
Stick to basic charts like bar graphs and line charts which are easy to understand for stakeholders.
2. Emphasize Key Metrics:
Highlight essential KPIs to direct attention to the most impressive data.
3. Incorporate Comparisons:
Show year over year or campaign to campaign comparisons to provide context for performance.
4. Add Descriptive Titles:
Use concise titles and labels to clarify the data’s meaning.
5. Choose Color Wisely:
Use color sparingly to highlight specific trends or metrics, avoid excessive color that may distract viewers.
Choosing the Right Data Analytics Tool for Your Marketing Needs
Each of these tools has unique strengths, so your choice should depend on your business needs and marketing objectives:
– For Small to Medium Businesses:
Google Analytics is a strong, cost effective tool for understanding basic website metrics and campaign performance.
– For Data Visualization:
Tableau and Power BI offer sophisticated dashboards that bring data to life and make it easy to share information.
– For Advanced Analytics:
SAS Analytics is ideal for businesses who need deep data mining and predictive information.
Conclusion:
The best marketing decisions are taken by analyzing data. If you are tracking user behavior, forecasting campaign outcomes or segmenting customer data, data analytics tools are essential in today’s digital marketing scenario. With a strong analytics foundation, marketing professionals are at advantage to move beyond guesswork, by using data to make precise and impressive strategies.
By selecting the right tool and applying data driven strategies, marketing professionals can optimize campaigns, understand their audiences better and ultimately, drive better results for their organizations.
Disclaimer: The websites mentioned above might evolve over time. Always refer to the website and their official documentation for the most accurate and updated information as well as latest offerings, plans and prices etc.
Thanks for sharing this valuable post! Quick heads-up— the cheapest cloud web hosting just dropped its prices even further, but only until April 17th! Snag this unbeatable deal before it’s gone!
Great insight! Managing cloud servers often seems complex, but Cloudways takes the stress out of the equation. Their platform delivers powerful performance without the usual technical headaches. It’s an ideal solution for those who want scalable hosting without getting lost in server configurations. Definitely worth checking out for a smoother hosting journey. Keep up the excellent work! Explore more through the link.